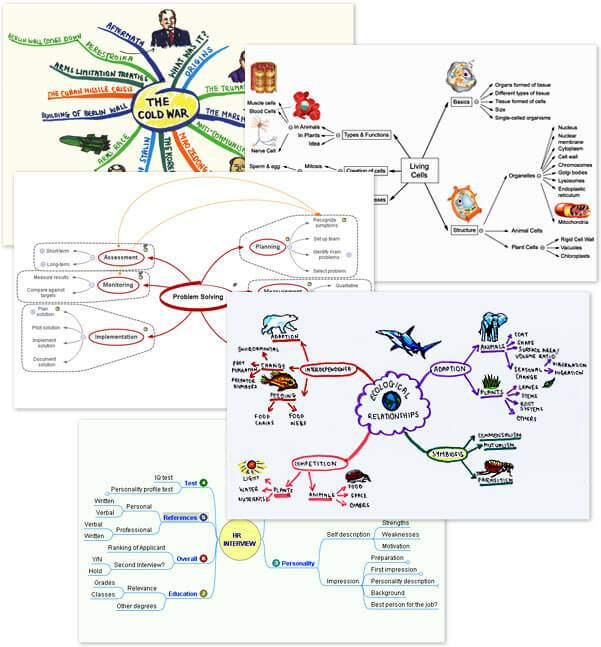
A Mind Map is a visual thinking tool that has many advantages compared to traditional note taking and writing techniques.
Mind Mapping converts a long list of monotonous information into a colorful, memorable and highly organized diagram that works in line with your brain’s natural way of doing things. One simple way to understand a Mind Map is by comparing it to a map of a city.
Mind Mapping increases learning and retention by up to 95% over conventional note-taking. The structure of Mind Mapping is fashioned after the way the human brain actually thinks, which is radiantly. The color, structure, and pictures in a Mind Map excite the brain and keep it interested so that it is more receptive to the information.
so you mean H1 would be the first level of the map, H2 would the second level and so on…
It could be an add-in of Joplin or better, a integrated menu which would convert each H1, H2, H3… into the corresponding levels but in a graphical way.
So the hard question is : is it difficult to implement a graphic module into Joplin ? And how ? Plugin would be a clean way for doing this
Please note that the resulting diagrams do not completely overlap. The Mind Map is thought of by a central idea, whereas the projectplanning visualizes the flow of activities.
A proper basic example of a Mind Map module would be:
Actually not. Maybe the notes can also be represented as graphs (Trilium does it for instance) and maybe there could be another type of note (beside .md) that utilizes mind map rendering and entry.
Imho, this would imply a major shift in direction for Joplin, meaning this comes with disadvantages like "dev resources spreading thing across multiple features" versus "focusing on doing one thing really well".
Not because jotting down the content of mindmap-nodes is hard. Like @psophos said H1, H2 hierarchy could be interpreted as a mindmap-tree structure with branchers and leaves.
But the graphical rendering is quite hard. For example yED does this fairly well. Their approach is "every model is UML" with nodes (objects and shapes) and edges (lines and arrows). yED lets you add and edit every object on a canvas or import it as data.
For example (for flowchart, but can be anything, like a mindmap):
I also thought about adding a mindmap button to the ribbon so that the user can pop up the edit window of the mindmap with a single button and save it in a note.
However, as a graphic design, mindmap requires a certain amount of development resources, and it can only be a simple version, just like xmind zen.
But for Joplin, this means that it is bulky, slow to load, and difficult to adapt across platforms.
We want to implement as much functionality as possible in one software, but this has many implications.
I also use mind maps, but I made a mind map in xmind zen and then dragged it as an attachment to the corresponding note in Joplin.
I think that mind maps are best made with third-party software, because if Joplin is implemented, it will be much larger and loading speed may be affected.
Even the mindmap module is larger than Joplin itself.
Hello,
I moved for a new application called Obsidian which is far easier for linking notes together (like a wiki) and instantly draws a graphical map of all your notes. It’s called Obsidian : https://obsidian.md/
Graphviz, markvis(not active any more), D3.js, UML, cytoscape.js
Python (networkx)
There are multiple libraries that can be used to create interactive graphs, where you also can label the edges, and make the graph time-depended if you like it to be ...
i.e. the graph only show nodes within a given time period ...
And some of this libraries can also be used as static graph/diagram tools and provide a lot more functionality than mermaid, including text based graphing ...
Licensing might be a problem for some of them, i don't know ...
This was just a tips about some libraries that can be used for both static and interactive graphs and support text based graph creation ...
I also added a feature request/wish for this in May 2019...
Not a mindmap specific, but support for a better diagram/graph tool than mermaid.
And I will again say that using some other library than mermaid, will also add the feature of being able to create interactive graphs, graphviz use svg, but there are js libraries AND python libraries that use canvas if thats needed...